13. Vue3 + d3.js 날씨 지도 최종 예제 코드
Nodejs 와 연동이 되었다면 다음 코드를 통해
화면에 날씨 정보를 표현할 수 있을 것이다.
먼저 request 시 Nodejs에서는 데이터 위치 정보도 같이 전달해야 한다.
전달되는 정보는 다음과 같다.
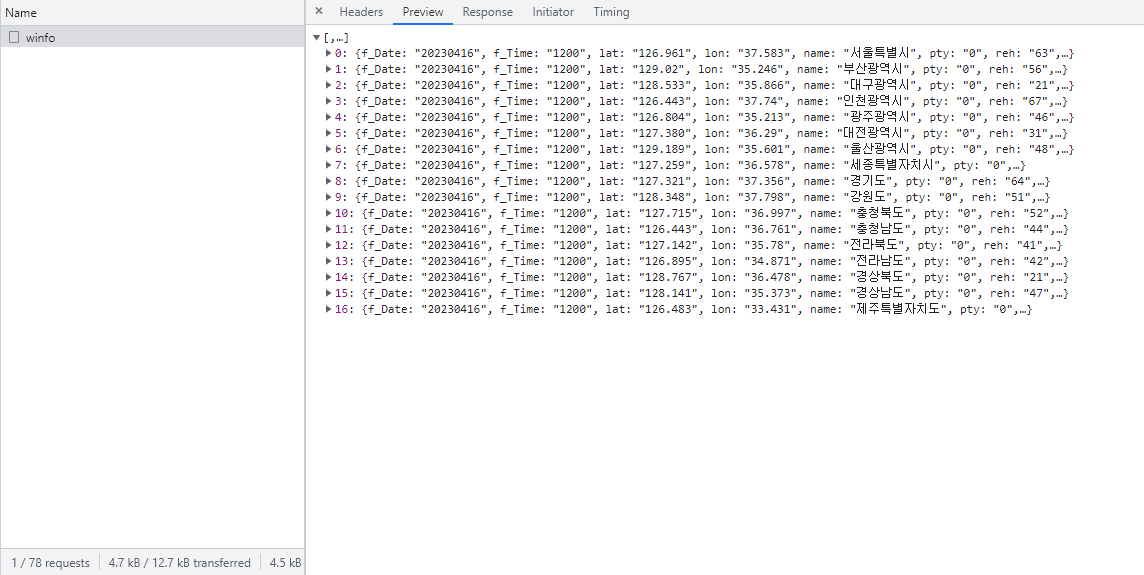
지역정보가 함께 전달되어야 지도위 정보를 바탕으로 위치를 찾을 수 있기 때문이다.
중요한 코드는 다음과 같다.
setup() {
const store = useStore();
store.dispatch("getWeatherInfo");
return {
mapdata: computed(() => store.state.weather.data),
loading: computed(() => store.state.weather.loading),
};
},
이것은 Nodejs에 request를 요청하는 코드이다.
getColor(area){
for(var i =0 ; i < this.mapdata.length; i++){
if(this.mapdata[i].name == area){
console.log(this.mapdata[i].name, area)
return this.getRange(this.mapdata[i].t1h)
}
}
},
getRange(cnt){
let cn = Number(cnt)
console.log(cn)
if ( cn < -15){
return "#1F618D "
}else if (cn >= -15 && cn < -5){
return "#5DADE2"
} else if (cn >= -5 && cn < 0){
return "#85C1E9"
}else if (cn >= 0 && cn < 5){
return "#EBF5FB"
}else if (cn >= 5 && cn < 10){
return "#FBEEE6"
}else if (cn >= 10 && cn < 15){
return "#EDBB99"
}else if (cn >= 15 && cn < 20){
return "#E59866"
}else if (cn >= 25 ){
return "#935116"
}
return "#CCCFCF"
},
위 코드는 시도별 날씨 정보를 기준으로 색을 표현하는 코드이다.
다음은 아이콘 표시를 위한 코드
function ChkIcon(d){
let today = new Date();
let hour = today.getHours()
if (d.pty == '0'){
if (hour > 7 && hour < 18){
return SunIcon
}else{
return MoonIcon
}
} else if (d.pty == '1'){
return RainIcon
}else if (d.pty == '2'){
return RainSnowIcon
}else if (d.pty == '3'){
return SnowIcon
}
}
기상 상태에 따라 아이콘을 표현하는 코드이다.
또한, 저녁이 되면 해에서 달로 표현코드로 추가하였다.
Vue3의 코드는 다음과 같다.
<template>
    <div id="map-wrapper" class="map-wrapper">
        <div v-if="loading" class="flex justify-center">
            ...
        </div>

    </div>
</template>

<script>
    import * as d3 from 'd3'
    import korea from '../../assets/mapjson/poparea.json';
    import * as topojson from "https://cdn.skypack.dev/topojson@3.0.2";

    import SnowIcon from '../../assets/snow.svg'
    import RainIcon from '../../assets/rain.svg'
    import RainSnowIcon from '../../assets/rainsnow.svg'
    import SunIcon from '../../assets/sun.svg'
    import MoonIcon from '../../assets/moon.svg'

    import {ref, computed, watch} from "vue";
    import {useStore} from "vuex";

    export default {
        name: "AreaPopMap",
        props: {},
        setup() {
            const store = useStore();

            store.dispatch("getWeatherInfo");

            return {
                mapdata: computed(() => store.state.weather.data),
                loading: computed(() => store.state.weather.loading),
            };
        },
        watch: {
            mapdata() {
                this.drawMap();
            }
        },

        methods: {
            getColor(area){
                for(var i =0 ; i < this.mapdata.length; i++){
                    if(this.mapdata[i].name == area){
                        console.log(this.mapdata[i].name, area)
                        return this.getRange(this.mapdata[i].t1h)
                    }
                }
            },
            getRange(cnt){
                let cn = Number(cnt)
                console.log(cn)
                if ( cn < -15){
                    return "#1F618D "
                }else if (cn >= -15 && cn < -5){
                    return "#5DADE2"
                } else if (cn >= -5 && cn < 0){
                    return "#85C1E9"
                }else if (cn >= 0 && cn < 5){
                    return "#EBF5FB"
                }else if (cn >= 5 && cn < 10){
                    return "#FBEEE6"
                }else if (cn >= 10 && cn < 15){
                    return "#EDBB99"
                }else if (cn >= 15 && cn < 20){
                    return "#E59866"
                }else if (cn >= 25 ){
                    return "#935116"
                }
                return "#CCCFCF"
            },
            drawMap() {

                const divWidth = document
                    .getElementById("map-wrapper")
                    .clientWidth;
                const width = (divWidth < 1000)
                    ? divWidth * 1
                    : 800;
                const height = width * 1;


                const geojson = topojson.feature(korea, korea.objects.poparea);
                const center = d3.geoCentroid(geojson);

                console.log(this.searchModalOpen, center)

                let projection = d3.geoMercator()
                        .scale(1)
                        .center(center)
                        .translate([0, 0]);

                var path = d3
                    .geoPath()
                    .projection(projection)

                 const bounds = path.bounds(geojson);

                const widthScale = (bounds[1][0] - bounds[0][0]) / width;
                const heightScale = (bounds[1][1] - bounds[0][1]) / height;
                const scale = 1 / Math.max(widthScale, heightScale);
                const xoffset = width / 2 - scale * (bounds[1][0] + bounds[0][0]) / 2 + 0;
                const yoffset = height / 2 - scale * (bounds[1][1] + bounds[0][1]) / 2 + 0;
                const offset = [xoffset, yoffset];

                projection
                    .scale(scale)
                    .translate(offset);

                var svg = d3
                    .select('.map-wrapper')
                    .append('svg')
                    .attr('height', height)
                    .attr('width', width);

                const g = svg.append("g");

                const _this = this;

                function fillFn(d){

                    return _this.getColor(d.properties.CTP_KOR_NM)

                }
                var tempColor = undefined

                const states = g.append("g")
                    .attr("cursor", "pointer")
                    .selectAll("path")
                    .data(topojson.feature(korea, korea.objects.poparea).features)
                    .join("path")
                    .style('fill',fillFn )
                    .on('click', function (event, d) {
                        d3
                        .select(this)
                        .style('fill', "red")

                    })
                     .on('mouseover', function (event, d) {

                            tempColor = this.style.fill;

                    })
                    .on('mouseout', function (event, d) {
                            d3
                            .select(this)
                            .style('fill', tempColor)
                    })
                    .attr("d", path);

                states.append("title")
                    .text(d => d.properties.CTP_KOR_NM);


                g.append("path")
                .attr("fill", "none")
                .attr("stroke", "white")
                .attr("stroke-linejoin", "round")
                .attr("d", path(topojson.mesh(korea, korea.objects.poparea, (a, b) => a !== b)));

                svg
                .append("g")
                .attr("fill", "black")
                .attr("text-anchor", "middle")
                .style("font", "12px sans-serif")
                .selectAll("text")
                .data(_this.mapdata)
                .enter()
                .append("text")
                .attr('x' ,  d=> projection([d.lat, d.lon])[0])
                .attr('y' ,  d=> projection([d.lat, d.lon])[1])
                .attr("dy", "1.3em")
                .text(function(d) { return d.t1h + '도, \n풍속:' + d.wsd});


                const iconsLayer = g.append('g').classed('icons-layer', true);

                iconsLayer.selectAll("svg")
                    .data(_this.mapdata)
                    .enter()
                    .append("svg:image")
                    .attr("width", 40)
                    .attr("height", 40)
                    .attr('x' ,  d=> projection([d.lat, d.lon])[0]-10)
                    .attr('y' ,  d=> projection([d.lat, d.lon])[1]-100)
                    .attr('opacity', 0)
                    .attr("xlink:href", ChkIcon)
                    .transition()
                    .ease(d3.easeElastic)
                    .duration(1000)
                    .delay((d, i)=> i * 50)
                    .attr('opacity', 1)
                    .attr('y' ,  d=> projection([d.lat, d.lon])[1] - 30)


                function ChkIcon(d){
                    let today = new Date();
                    let hour = today.getHours()
                    if (d.pty == '0'){
                        if (hour > 7 && hour < 18){
                            return SunIcon
                        }else{
                            return MoonIcon
                        }

                    } else if (d.pty == '1'){
                        return RainIcon
                    }else if (d.pty == '2'){
                        return RainSnowIcon
                    }else if (d.pty == '3'){
                        return SnowIcon
                    }
                }

            }
        }
    }
</script>

<style scope>

.map-wrapper {
    position: relative;
    padding-left: 20%;
    text-align: center;

}

</style>
위 코드를 사용하여 날씨정보를 표현할 수 있다.
최종 화면은 다음과 같다.
삽질을 열심히 하면 언젠가 성공하는 날이 온다.
